Looking for Some Wisdom

Whenever I finish a new post I will tweet out a message about it and I often encourage people to drop on by and share some wisdom. I definitely need some tonight.

Had a great conversation with a colleague today about his Algebra II Honors class. They are examining exponential functions and are ready to talk about logs. He came by with what seemed like a straightforward question – but it no longer feels like it is. He sketched the graph off y = 2 ^ x and marked pi on the x-axis. He talked about working his kiddos through the argument that there must be some power of 2 that yields pi as the answer. He talked about a method of exhaustion making better and better guesses to get closer and closer. We talked about how this conversation could be approached as carefully as possible. I talked about the intermediate value theorem but advised that it not be named yet. I talked about temperature during a day and speed on a car’s speedometer. But as he pushed me I realized that all of these arguments rely on comfortably knowing that this function is continuous and that if 2 ^ 1 = 2 and 2 ^ 2 = 4 that there MUST be some value of x between 1 and 2 so that 2 ^ x = pi. We ended the conversation – because I had a committee to run to – with this questions: How do we convince Algebra II students that this function actually does have to have an input x that yields every output y in a region? How do we recognize a function as continuous? What are the markers? This feels like a question that I should have had a better answer for and maybe in October when my brain is smarter I might have. So, I ask you out there – how can we convince Algebra II students that there is some real x so that 2 ^ x = pi?
Trying to Understand a Curious Misunderstanding

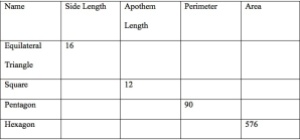
Last week it felt as if my Geometry class as making great progress in examining radians, looking at areas of regular polygons, dealing with a new vocabulary word (apothem), and generally doing a nice job of making connections – especially with the right triangle trig that we are now leaning heavily on. Well, Friday morning we had a conversation that I am still unpacking. On their HW from Wednesday night one of their tasks was to complete the table below:Polygon Table

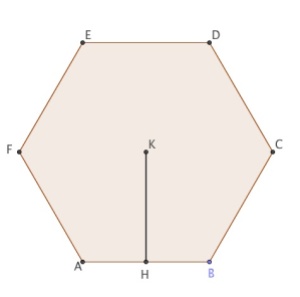
When my students asked me to review this problem I started by drawing an equilateral triangle and its apothem. I know that it is more efficient to use our knowledge of the triangle area formula, but I wanted to reinforce our new formula that the area of any regular polygon is half of the product of the apothem and the perimeter. Unfortunately, when I drew the picture they asked me why I drew what I drew. They wanted instead to draw an equilateral triangle and its altitude. I followed this suggestion by drawing the following figure:                                       Incorrect Apothem

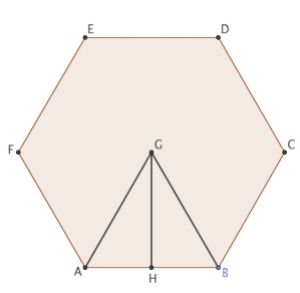
They were quick to identify that this is not, in fact, an example of an apothem. Pretty much everyone agreed to this quickly. Instead they instructed me to draw the following figure:

Correct Apothem

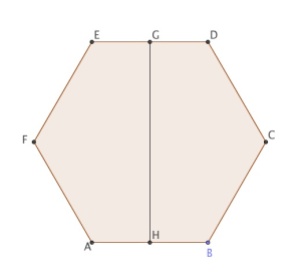
I have been trying to figure out why so many made the same mistake and, after talking to one of my Geometry teaching colleagues, I have a theory. I keep drawing pictures like this one: Polygon with Inscribed Triangle

I fear that seeing this drawing repeatedly has somehow convinced some of my students that the altitude of a triangle is simply the apothem. I know that I pointed out the similarities between the terms when I was trying to help them remember this new word. I talked about how altitudes and apothems were each perpendicular to a side (and that they both begin with the letter a). However, I do not know why some students would simply draw an altitude and figure that, for some reason, we are now calling it an apothem. So this was a disappointing way to start the day. I think I feel a little better now that I have a feeling where the triangle mistake came from. Have any of you experienced something similar?

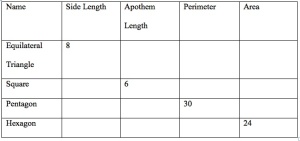
The other disappointment came when they asked me to address the next HW question. They were again asked to fill out a table, Here is the second HW problem:

Second Polygon Table

I suspect that most of you see some similarities between the first two HW questions. My students did not. I understand that when you are learning something new it is hard to step back and see big picture things going on. However, I also know that this type of HW problem is tedious and I hope that my students are thinking of ways to streamline the process. Instead of recognizing that the triangles in the two problems are in a 1 to 2 ratio and using our knowledge of similarity and scale factors, many students simply reset and did the problem from scratch. I try really hard to build in these sort of  connections in my assignments and my tests. I do not expect students to recognize that in October, but I would hope that they do by May. I’d love some advice about how I can better help my students look for these types of connections. How can I help them step back a bit and see these connections?

Back at it 8 AM tomorrow. I’m optimistic we’ll have a good week. Test on Wednesday – I want them to really kill it on this one.

Catching Up with the Past Week

So there are a couple of activities this past week that I want to write about. However, I have been swamped with meetings so I have fallen a bit behind.

In AP Stats we have finished our required curriculum as of 8 days ago. I am a big baseball fan and my favorite team is the New York Mets. They are having a pretty wonderful start to their year (or at least were until the last few days) so last Friday I posed the following question to my kiddos: Given that the most optimistic projection I saw for the Mets’ season had them pegged as an 87 win team, what is the likelihood of their current record (which, if I remember correctly) is 10 – 5? I liked this for a few reasons. First, it concerns baseball and likely would have a positive outlook for my Metropolitans. Second, it was not so focused on the most recent material at hand. My Stats students tend to know recent material well but struggle remembering other procedures that have not been practiced as recently. Third, it generated some nice thinking out loud about what approach to take. Being more of an algebra stream guy myself I immediately placed this in the context of a probability problem and was prepared to go down a Pascal’s triangle/binomial theorem path. Most of my Stats students don’t tend in this direction so their conversation focused instead on comparing proportions – the 87 – 75 projection with the 10 – 5 proportion. They suggested running a two proportion z test and looking at the corresponding p-value. This opened up the avenue for me to sneak in my approach and make a connection pretty visible to them. Turns out that we felt that we had enough evidence to reject the null hypothesis of the Mets being an 87 win team in favor of believing that they will exceed that win total. Their recent 5 – 5 run of games might adjust that but I do not want to know this – so I will not re-run the test right now! After we checked our trusty TI to find the p-value of this test I reminded them of the probability approach and we set up the appropriate term of the binomial expansion. Guess what happened? This calculation matched the p-value of the two proportion z test!!! This is one of those ideas that we discussed but somehow seeing these results side-by-side seemed eye opening to my kiddos. A triumph on a number of levels!

In my morning Geometry class we dipped our toes into an exploration of radians yesterday using the ProRadian Protractor designed by the fantastic Jennifer Silverman (@jensilvermath) and using an activity that she designed. I wrote a follow up HW assignment that my kiddos worked on last night. I also linked to a fabulous web site that allowed my students to explore radian measure and I shared these notes with my colleagues. There is also a lovely GeoGebra applet (also designed by jennifer Silverman) that is linked from the worksheet. I was totally excited to explore this activity with my students and I had a really nice chat with one of my teammates.

I handed out the radian protractors as well as our regular old angle protractors and we had a nice conversation about similarities between the two protractors. We had a lovely discussion about this but, looking back on yesterday , I think I allowed too many clues to seep into the conversation too quickly. Jennifer’s activity is a terrific one and I got in the way by loading too many conversations in at the beginning of the class. By having students come to my screen and try to identify where one radian measure would lie on the circle AND by having the protractors side-by-side I reduced the mystery element that I think should have been part of the classroom activity. I think I took away the opportunity to discover what was happening here. I did have one student give a GREAT explanation of why the quadrilateral radian measure was twice the triangles radian measure. She invoked a proportional idea and referenced our (n – 2)*180 formula. I had a number of students quickly see that the ratios we had been working with before (frac{x}{360}=frac{arc}{2pi r}=frac{sector}{pi r^{2}}) could be easily extended to add one more simple fraction of frac{x}{360}=frac{theta }{2pi }. That definitely felt like a triumph. So, the lesson I learned here – and I hope I remember it for next year – is to be a little more minimalist in front loading this conversation. I think that we can touch on all of these resources and really let the discovery sink in, but I feel I nudged them a little too much this time around. So the plan for next year is to hand out the radian protractor and work through the worksheet. Then hand out the angle protractor and talk about comparing them. Then, the next day after some time to think, show the web app and have them identify where one radian is. Let this unfold a little more slowly.