I have used this space for years as a platform to talk about math teaching. Today I am going to use it for another passion of mine. Today I am thinking about music. Many of you (most? ALL?) follow me on twitter and you know that I have been fortunate enough in the past year to score a DJ gig at a local college. I have been posting all of my playlists on Spotify where I can be found (as on twitter) as mrdardy. I have been a bit obsessive about music since my middle school years. In college I worked in a record store. After college, in my early teaching years, I wrote for the local newspaper and then for a free news monthly. Later, when I moved to south Florida I wrote about music for another magazine there. I am pretty deeply obsessed.
As evidence – here are my CD and LP racks in my basement.
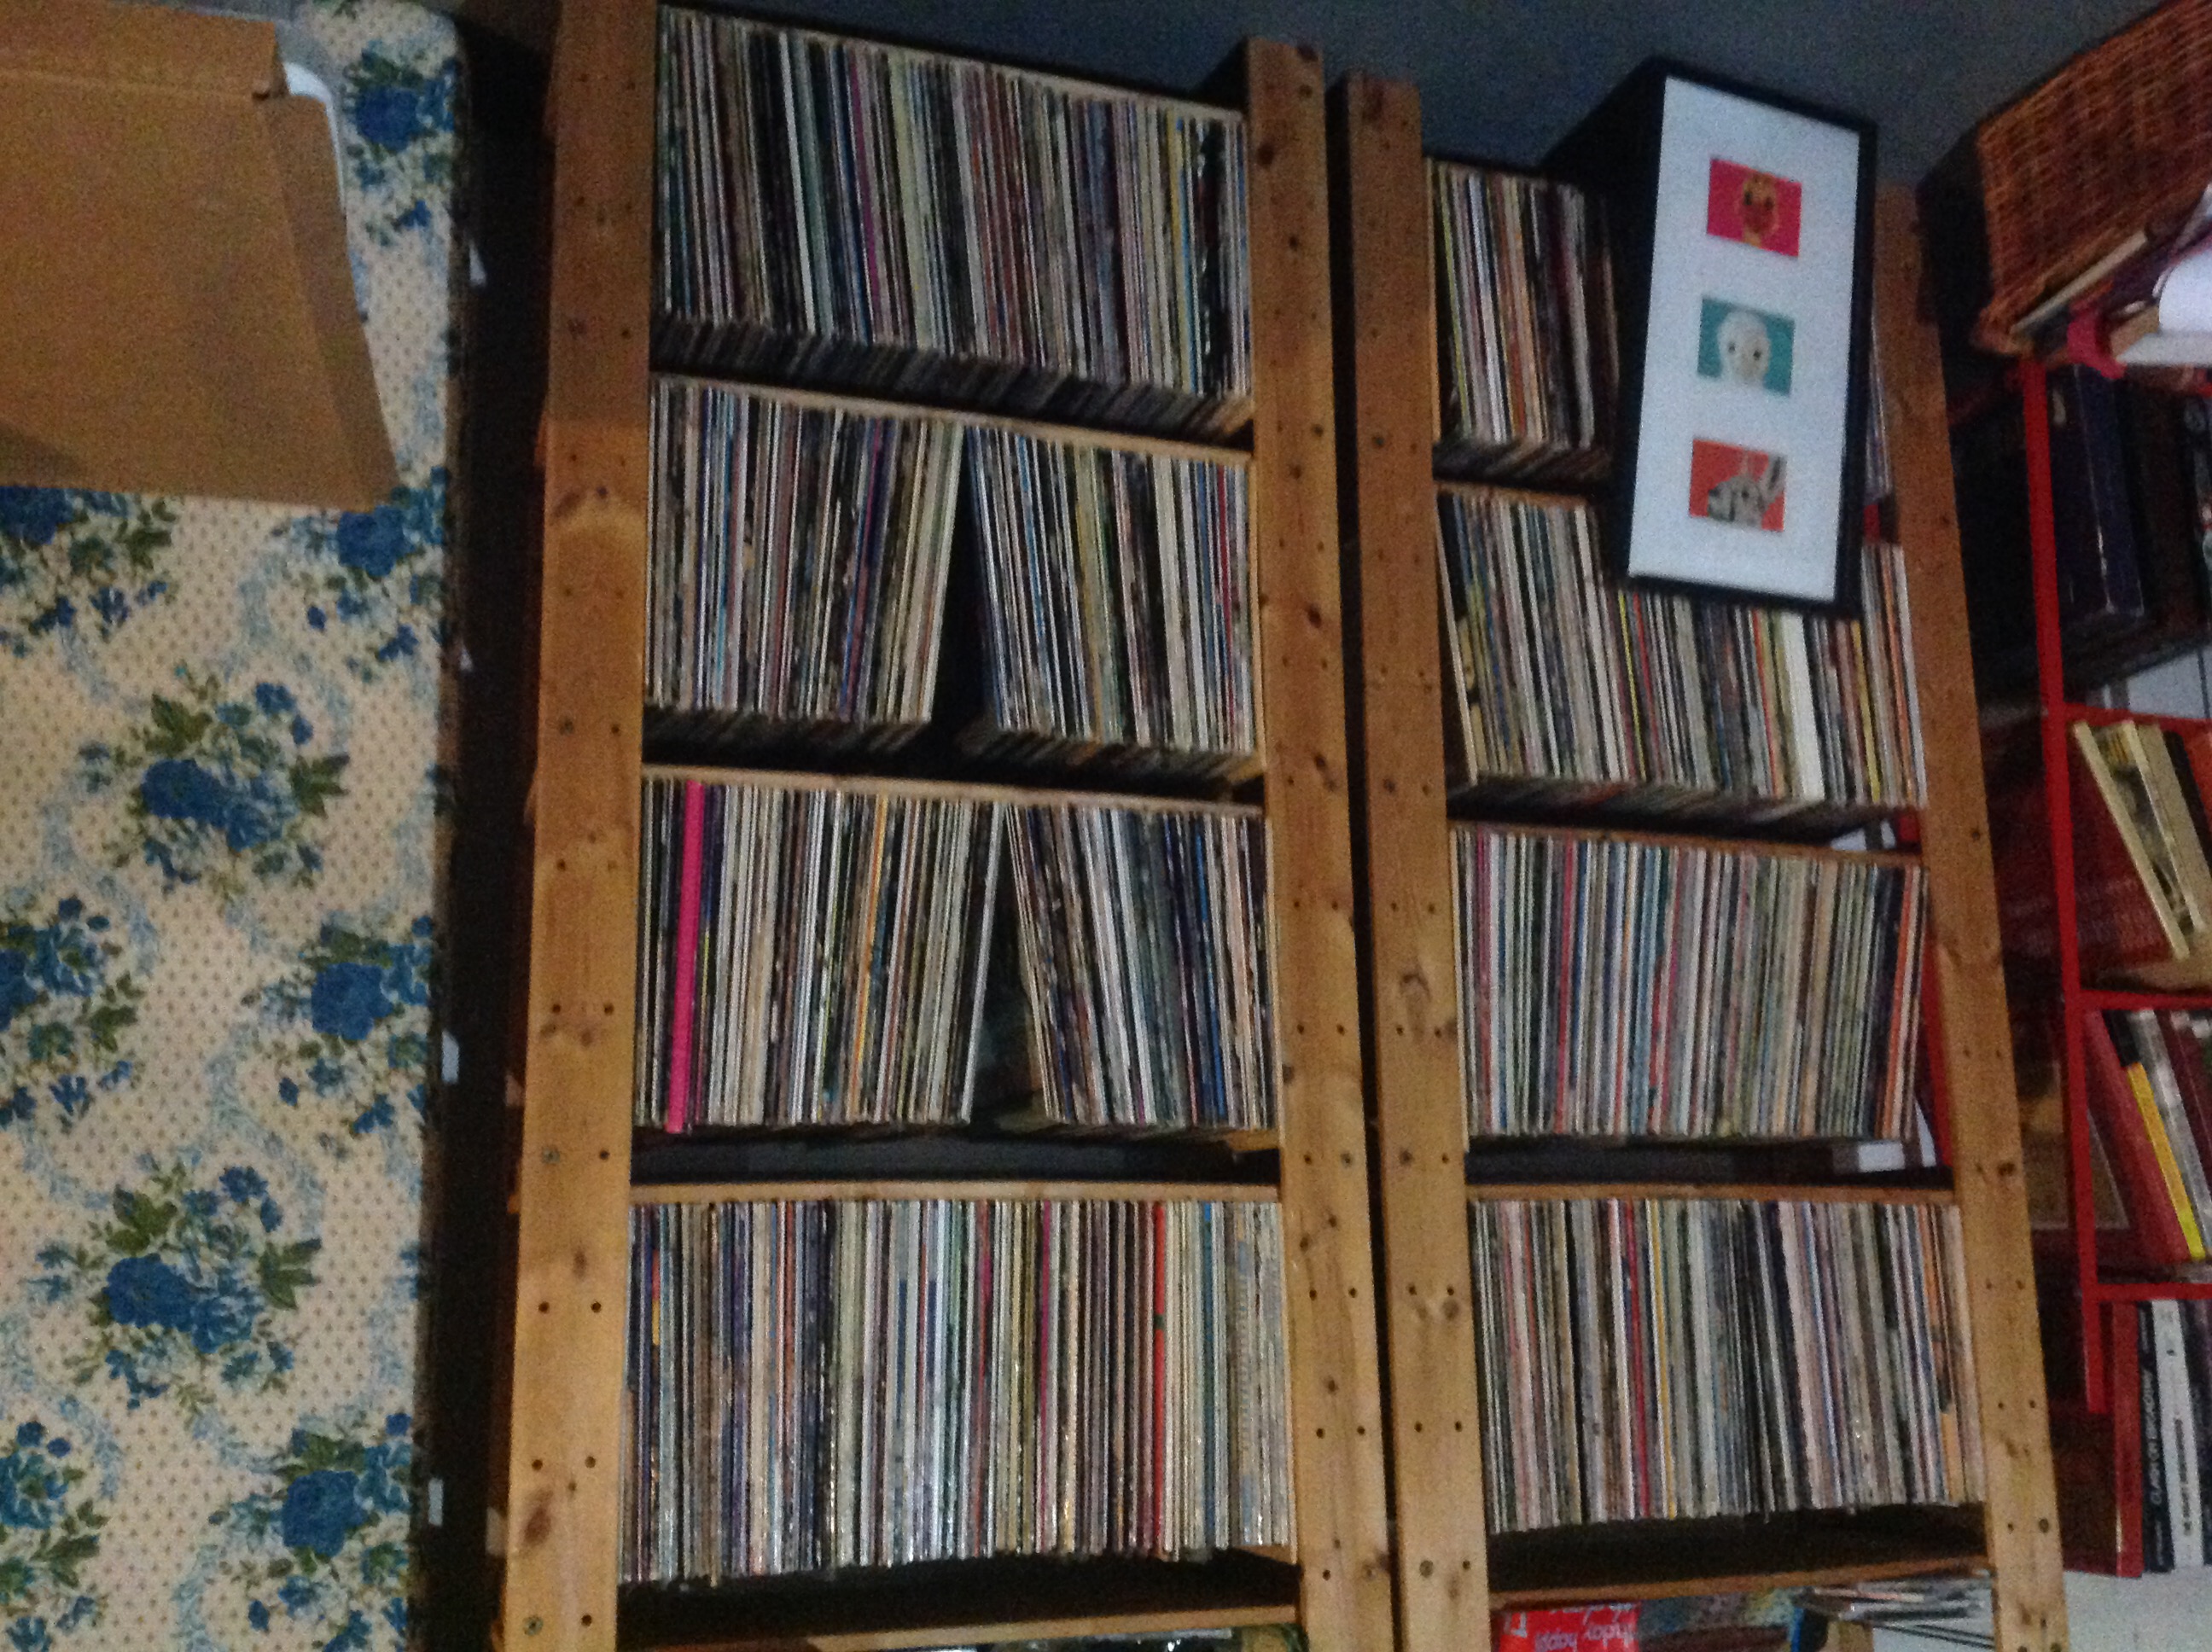
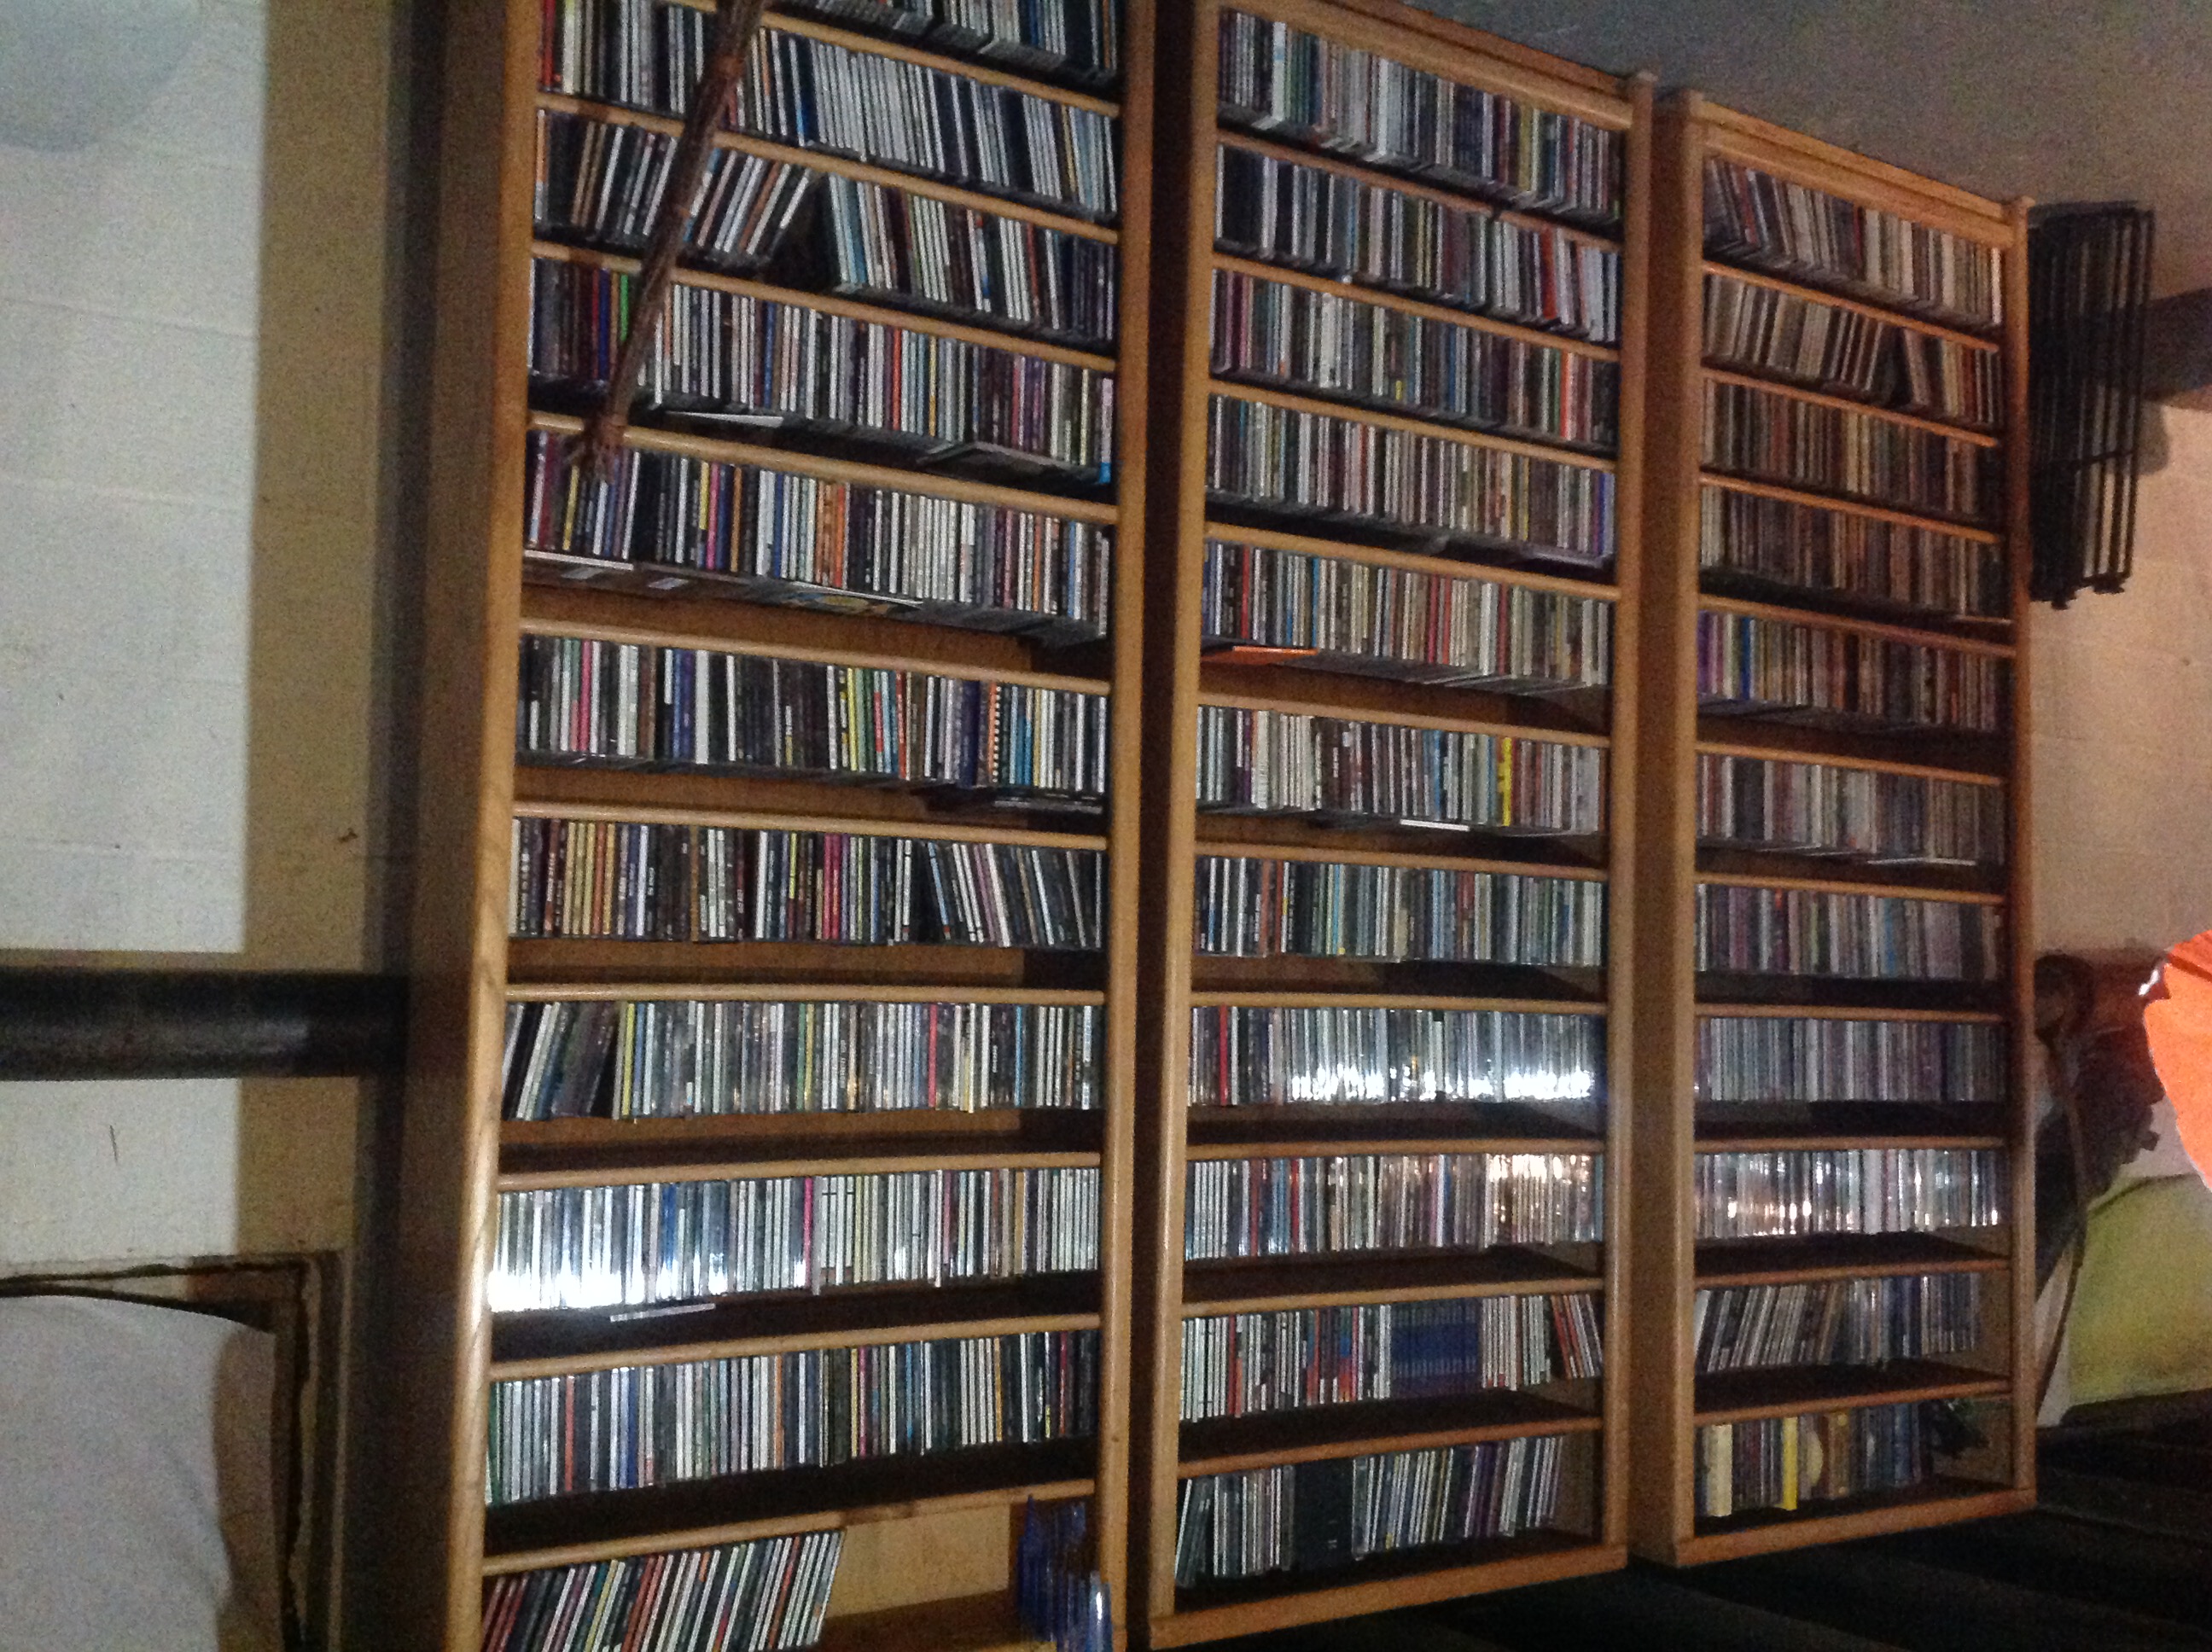
For reasons I do not understand, each image is upside down. Oh well, the point is made.
Part of what has come along with the music obsession is a good bit of snobbery. Long ago I stopped listening to radio to find music and dove deeply into music criticism and word of mouth. I can recognize labels and producers and often purchase something simply because of some arcane connection to something I already love. The I had a child. Then, six years later, another one. I stopped going to shows. I moved. I let myself wallow in my collection and got swept up a bit in the huge world of streaming music. First Pandora, then Spotify. I probably could have gone for the rest of my life without really digging in and learning new music again but the DJ gig saved me from that. Somewhat at the same time, my son (now 15) started really getting interested in music. In the past year I have taken him to see Gorillaz (I quite like them and was happy to go), Tyler the Creator (not quite as happy), and Kendrick Lamar (glad I went but much of the show was not my style). I have been really delighted to see him so animated by something important to me and it gives us a safe venue to talk which is not always easy with 15 year olds in the house. I don’t love the music he loves. I feel life an old fart being bothered by the language of much of the music he listens to, but I remind myself of generations of parents complaining about ‘that noise’ that delights their children.
All of this concert business with my son has made my soon to be 9 year old daughter (birthday Wednesday!) jealous. She has started listening to pop radio and has her own pretty extensive playlist on Spotify. Listening to this station of hers is trying for me. I am not a fan of the style and they seem to play only about 8 songs over and over again. On the other hand, it brings her joy and it is music. So, last Friday I took her to Philadelphia to see Charli XCX, Camila Cabello, and Taylor Swift. I think that all of you reading this know Taylor Swift even if you don’t know much of her music. The other artists, probably not so much. I had not knowingly ever heard Charli XCX but I discovered that I did, in fact, know a few of her songs. So, when she asked me to go to see her #2 favorite singer (Camilla) and her #3 favorite singer (Taylor) I kind of had to say yes.
The show was at Lincoln Financial Field – home of the super bowl champion Philadelphia Eagles. I am pretty sure that the last time I went to see a stadium show was when I saw The Who as a freshman in college (1982 or 1983) with Joan Jett and the B-52s as opening acts. I am used to seeing shows in clubs where I can be 50 feet from the performer or in nice old theaters where the acoustics are great and the seats are pretty comfy. We were FAR from 50 feet away from Taylor, Camilla, and Charli but that did not phase my lil one bit. From the time that Charli XCX came on at about 7:10 PM to a crown only about 1/3 of what it would soon be, my daughter was engaged. Charli XCX was energetic and passionate. She worked what crowd was there and she kind of won me over. Camilla Cabello had a tight, synchronized, and choreographed set. She played most of the CD my lil has and she mixed in bits of Frank Sinatra and Prince in the middle of songs. She is still pretty new to this business (she was previously in the girl group 5th Harmony) but she will likely have a long career ahead of her. Then Taylor Swift came on.
What a spectacle. There were probably 40 semi trailers in the parking lot that had been carrying the three stages for her performance in addition to the fire, the 40 to 50 foot video screen, the fireworks, the cables that transported her from one stage to another while she sang, the cameras, etc. etc. etc. I have to say I was there out of a sense of duty and a sense of wanting my daughter to have a meaningful memory of an adventure with dad. She knows I love music and I think that she wants to connect with me on this field (as does my son – I am flattered in both cases) but I was fighting my snobbery and my cynicism. Let me tell you, it melted away quickly. Her opening numbers were from newest album and I am not terribly familiar with them. I bought my daughter the 1989 album and know all those songs. I know some of the older country-ish songs and I know a couple of the newest ones. It didn’t matter. The show was so energetic and spectacular, the songs are so carefully crafted, and the JOY of over 50,000 people cheering and singing along is simply transformative. I found myself so swept up by the whole thing. My daughter was taken by it, the crowd near us, the whole damned stadium was in the palm of her hand.
Now, I do not imagine that I will be dialing up the music of any of these artists during my free listening time. I will hear them because I live in this world and because I have a young child in my home who is taken by this music. I will, however, hold on to the memory of this show. Not just because I hope my daughter will treasure this but because it cracked through my grumpy music snob exterior. It made me smile and sing along to songs that don’t particularly matter to me because I was in a crowd of about 50,000 people to whom these songs really mattered. Because this talented artist who was playing in her home town really cared about the fact that she was coming home. Because she has crafted a show (hell, a career) designed to bring joy to large groups of people together. Because it was a summer night and a beautiful one at that. Because I was proud of myself for having made arrangements for this event. Because I just love music. I love being in its presence, even when it is music I do not inherently love.
I have seen hundreds of nights of live music in my life. I am totally lucky in that respect. I have distinct memories of dozens of those shows/nights. This show will definitely live in the small set of special nights for all sorts of reasons.
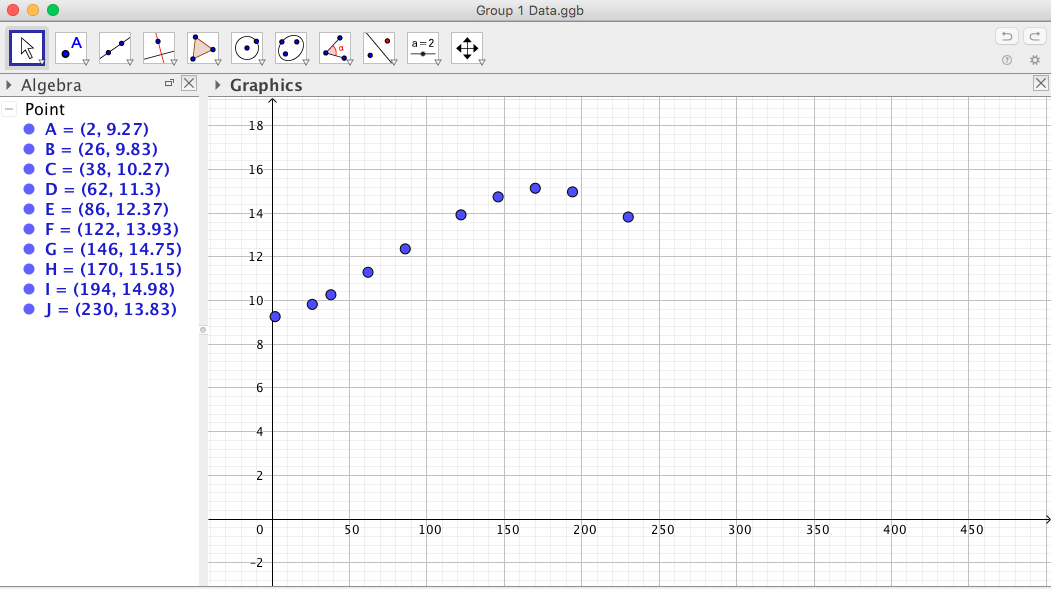
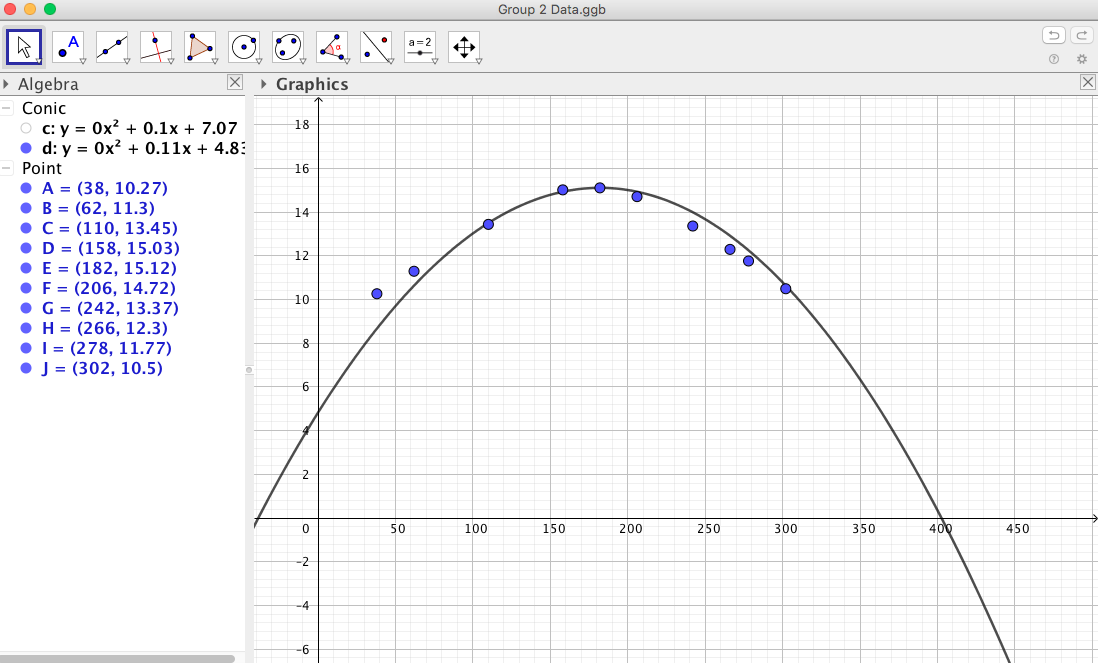
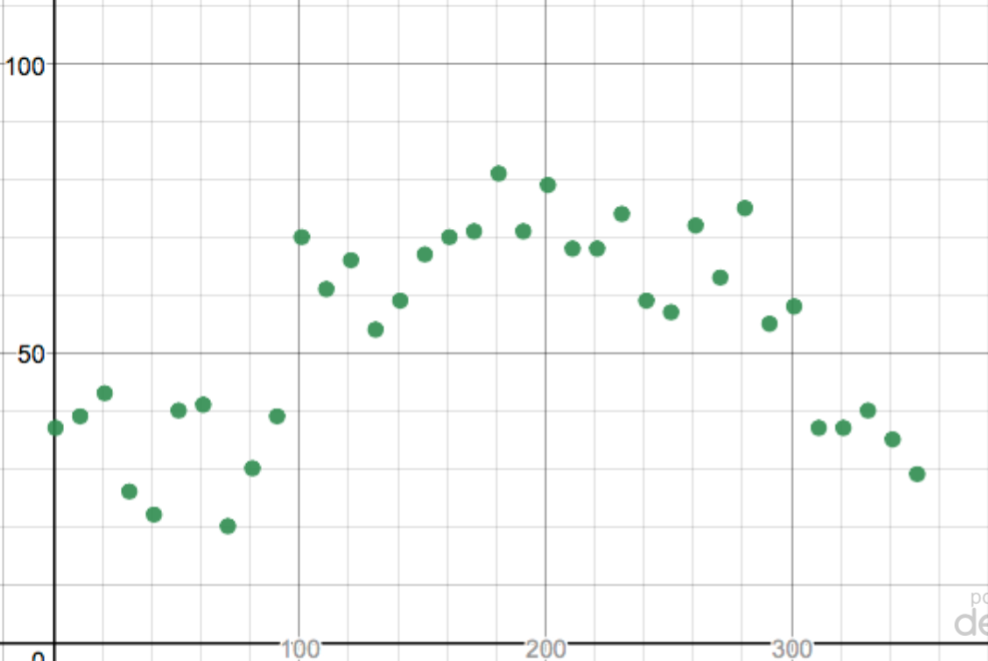
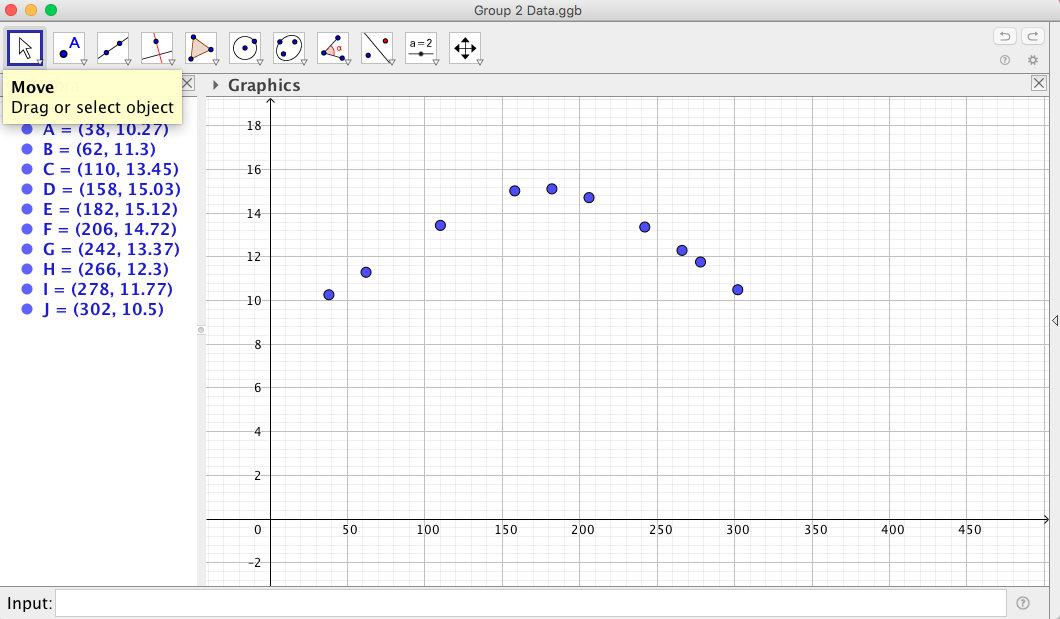 Group two will generate something similar to this image. Again, I am anticipating a quadratic guess. This time point E should be seen as the vertex. Playing a bit with my TI and anchoring my guess at point E yields the following promising picture.