Thinking About Trig

In the fall I will be teaching a section of Precalculus Honors at my school. I have not taught that course in about six years so I have not spent a bunch of time thinking about teaching trig functions for awhile. Our Precalc Honors class starts off with a study of Trig and I am thinking about an opening day activity that might plant a number of seeds that we will need to germinate over time. I want to play with some data that is periodic in nature and try to generate some hopefully interesting questions. Thinking along the lines of Dan Meyer’s challenge of finding an aspirin. I tweeted a bit about this and have been engaged in a terrific conversation with Bonnie Basu (@GotMathHelp) about a similar activity that I used as a demo lesson for a job interview years ago. The context is different since those students had already been a bit immersed in their study of trig but they had not been graphing yet. My goals with that group were to uncover the periodic nature of the hours of daylight, to talk about why other functions that seemed appropriate to the picture (especially quadratics) were not appropriate, to build up some sense of important vocabulary for trig graph analysis, and to simply plant some important ideas that would be explored in greater depth after I was gone. Looking back on the activity I see all sorts of tweaks I want to make and Bonnie has been super helpful in asking questions/making suggestions. Anyone who wants to take the time to share ideas or questions would certainly help make the beginning of my precalculus class this fall more meaningful and successful. I thank you in advance for any tips.

After another round of conversation on twitter that included tips from a student who just graduated from our school, I have been playing with three different data sets. I want to play with average daily temperature, high tide level, and with daylight hours. The data for the first two came from wunderground and the third data set came from dateandtime. Below are pictures of the data and Desmos links to the tables.
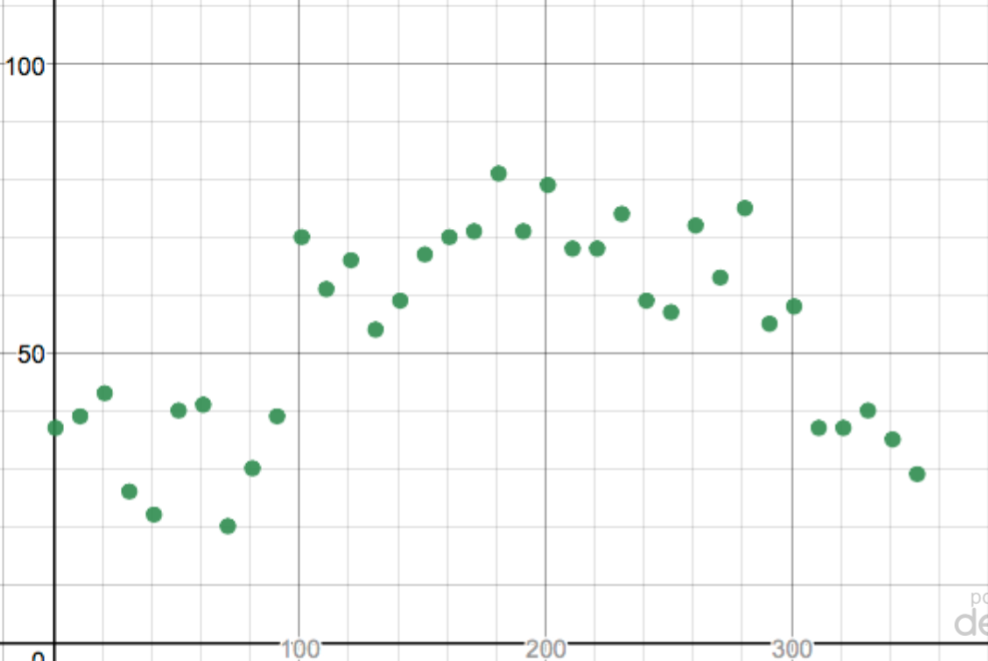
This picture (above) shows the average daily temperature in my town during 2017 at 10 day increments. You can see the Desmos table here. There are some things I like about this picture. I like the fact that the general shape can be inferred. We can talk about why it fluctuates on a number of different levels. However, I don’t think that this is a great data set for beginning to develop an idea of periodic functions. It feels too noisy to me.

Here is the picture for high tides.
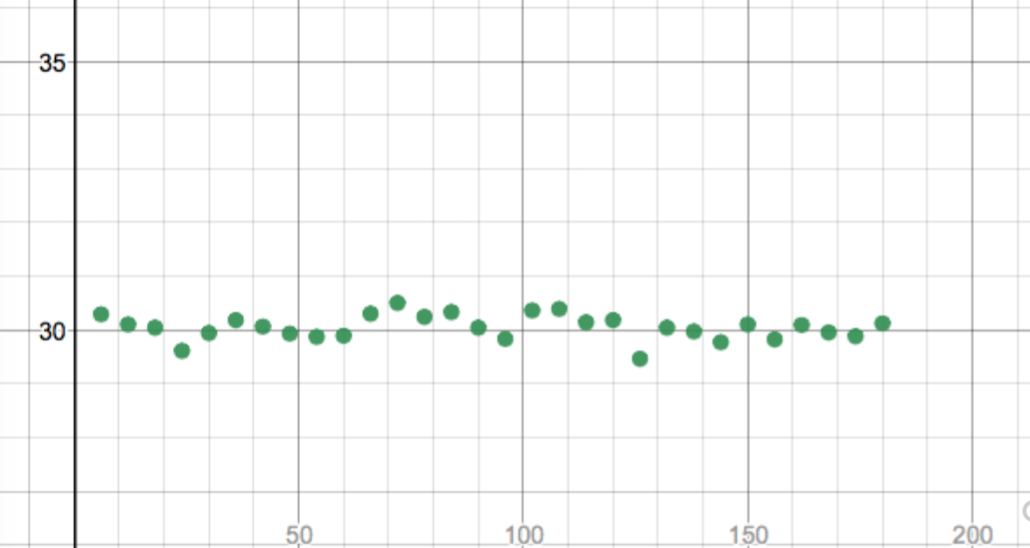
This table was built on data at 6 day intervals from the beginning of the year through June/July. You can see the Desmos link here. I would definitely ask the students to play with window sizing and I think that some powerful ideas about amplitude and vertical shift can quickly come out of such a conversation. I picked 6 day increments thinking that I would be slightly off phase with what I thought would be a period related to the full moon. A quick survey on google just talks about a 12 hour plus period so I may have been making this up in my mind. This picture feels more friendly with just a little noise involved. I might use this one early – maybe even on day one. The next one is much cleaner looking. Here is the data on length of daylight hours during 2017.
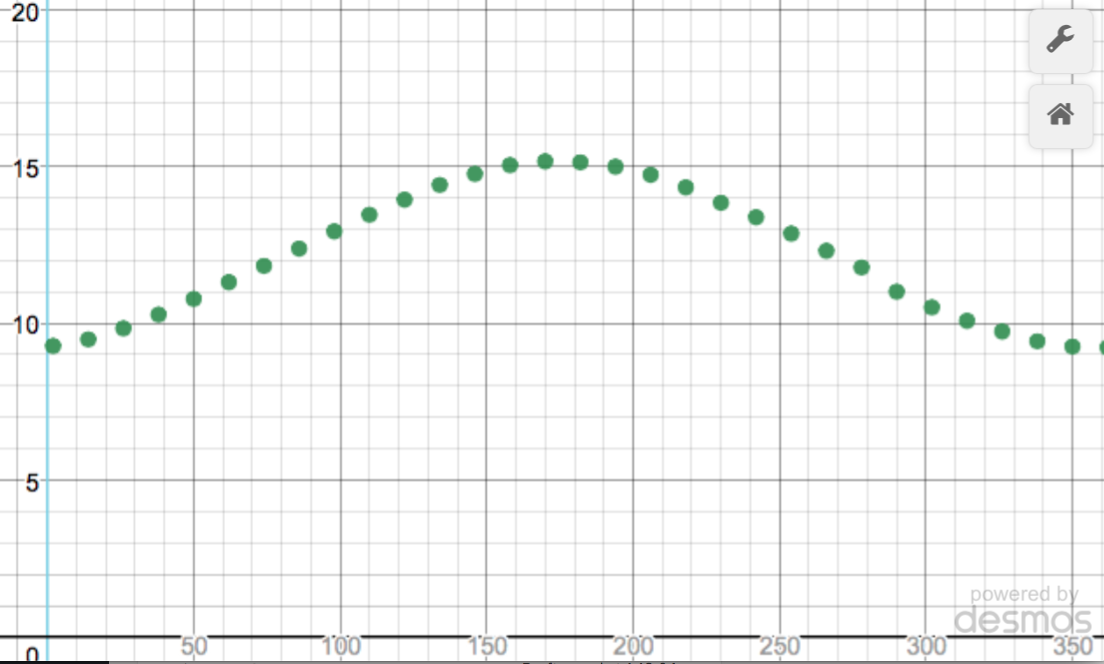
This is where my mind was when I created the demo lesson. However, this data is for our hometown here. You can see the Desmos link here. My thoughts about this data set go down two different paths. One thought is that this is clean and clear and easily explainable. One tweak I might make based on my conversation with Bonnie is that I might extend past one full year (say about 400 days or so) to make the periodicity visible not only intuitively meaningful. My second thought is that this might be too clean that it might lead my students into expecting such clean, clear periodicity in a messy world. I am probably overthinking this on the second train of thought.

I expect to have five table groups of students (groups of three in my classroom after long debating it, I accepted the wisdom shared by a number of MTBoS folks – especially Alex Overwijk (@AlexOverwijk) and my classes were better this year because of that change!) and I am thinking that each table group should have different data. I am playing with the idea of mixing up sunlight or tidal subsets of data versus simply subdividing one larger set. For example, if I go with the cleaner daylight data I can extend it to about 450 days or so and give different table groups subsets of about 35 data points each. I feel that they would benefit from seeing how the data ‘fits together’ and that individual table group decisions about amplitude, vertical shift, and period all match each other pretty well.


I would love some feedback/suggestions/questions and I thank Bonnie again for her valuable thoughts. You can drop comments here or over on twitter where I am @mrdardy

It’s Not Just a Dream – The Reality of a Data Project

When I last dropped by my own blog here to write I was cooking up an idea for my AP Statistics class. I wanted to write a good activity to explore data using my FitBit. I was lucky enough to win a FitBit Flex in a raffle and I’ve been fascinated by it for the past month. I had four volunteers who also shared their FitBit data with me and I put my data (identified) with the data of my four brave volunteers (not identified) and developed what feels like a pretty good activity. Yesterday I displayed my data in an EXCEL sheet before deciding I was better off in a Google sheet. We looked at my data together and with Desmos open we transferred some data two columns at a time and looked at lines of best fit. We tossed around some questions that seemed interesting, we questioned some of the data presented (especially the first data line on the sheet identified as Doherty Data), we made guesses about what relationships were hiding. We discussed the impact of height and weight and just generally had a pretty good time noticing and wondering together. Last night I combined all the data into a Google sheet (which can be found here) and I condensed some of the questions that came up yesterday and wrote them up on a Google form (which can be found here) and today I just set my kiddos loose. We have access to a computer lab so everyone had their own space to work. I dealt cards at random to spread the sheets around, I wandered and answered questions about moving columns on google sheets and how to make Desmos (like this graph) work its regression magic. I had discussions about resting heart rate, about whether calories burned or active calories were more interesting to look at. We remembered the dangers with extrapolation when discussing the y-intercept of these regression equations. We tried to figure out which mystery person might be taller or which one might be heavier. There is real joy in listening in on these conversations, but my biggest highlight today is that I got to show off the spirit of my classroom to a visitor today. He remarked on what a treat it was to witness ‘sense-making’ in action. I want to revisit my questions and make them better next time around, but I am pretty pleased so far. Tomorrow, we’ll start class with about ten to fifteen minutes to wrap up this activity and then we’ll share our discoveries with each other.

Right now my AP Calculus BC class is taking their final test of the term. I hope I am as happy grading those as I am thinking about my AP Statistics team right now.

Wrestling with the Modern World

Sometimes I am convinced that the universe is sending me important messages to sort out. I am not sure if I am always up to the task of making sense of these meanings. In my last post I was wondering aloud about how to incorporate technology into my assessments in a way that made sense. I asked my Calc BC kids to wrestle with a tough problem about circles. The problem made much more sense (to me, at least) when I graphed it using GeoGebra. It allowed me to lock in on a region of reasonable solutions. I asked if anyone out there has logical ways to incorporate this newer technology during assessments. For years my students have come armed with TI calculators. Sometimes they know how to unlock its powers, sometimes they do not. Somehow, the world of GeoGebra and Desmos (and Wolfram Alpha, and and and) seems more dangerous or intimidating to open up to classroom assessments. I worry about how to evaluate my students’ progress when I do not know where/how they found answers. So, that’s one part of what is in my head now. I have struggled with cell phone presence in my school. A little background might help explain where I am. Eight years ago when we moved north I became involved with our local Unitarian Universalist church and I volunteered as a youth group counselor. I attended a number of weekend ‘Cons’ with our youth. One of the persistent messages at these events was that this was an intentional community that was being created for the weekend. The youth were urged to be present to each other and to the event. They were expected to put electronics away for the weekend and they were asked not to engage in public displays of affection. For the most part, they bought into these requests and the energy was palpable. Kids were engaged with each other, they were talking, singing, laughing. It was a fantastic, but exhausting, weekend environment. Just last week I visited a school and sat in on four classes and two assemblies while I was there and did not see one student (or one faculty member, by the way) staring at a screen in their palm or in their lap. Kids were present to each other, to their classes, and to their assembly speakers. I found it refreshing. In my school there is a gathering area right outside my classroom window and I often see two or three kids on one bench all staring at their phones. I know that this is my bias (maybe this bias belongs to others as well!) but I find this dispiriting. In my class, I tend to stand near the door to greet people as they come in and some of them are trudging through the halls staring in their hands and barely aware of those around them. I used to have to spend time getting my classes to quiet down at the beginning of class because they’d be talking to each other as they sat down. Not so much anymore. Again – I know that this is my bias here, but I find this a bit depressing. I try to utilize the language from my UU experiences and since I teach in an independent school I CAN invoke the idea that there is a choice made in being at our school. The reality though is that this choice is often the choice of parents and not my students. At the youth group it was much more a matter of choice by the youth engaged. So, after my school visit I was feeling that my bias was being confirmed and supported by the environment of the school I visited. Then my brains was rocked yesterday by Justin Aion. Justin blogs over at http://relearningtoteach.blogspot.com and his posts (nearly daily ones!) are a treat. I have also had the pleasure and privilege of getting to know him in person here at a workshop we hosted (run by the wonderful Jennifer Silverman) and at twittermathcamp this summer. He is as delightful in person as he is through his blog. Yesterday Justin wrote a pretty moving post (you can find it here) about cell phones and I want to try to address his points as a way to help me clarify my own mixed feelings. His final point is the most important (by the way – read his whole post, don’t just take my highlights!):

If the answers to my tests can be looked up on Google, are they really worth asking in the first place?

I want my students to be creating, to be evaluating, to be synthesizing information.  I want them forming opinions and interpreting answers.  It would be great if they could determine the circumference of a circle from it’s diameter.

It would be better if they could tell me which of the given answers is the most reasonable estimate.

A smart phone can’t make judgement calls.  They can’t interpret answers.

If a smart phone can answer my test questions, I’m asking the wrong questions.

I agree 100% with these sentiments. When I first visited my current school I saw a chapel presentation that completely won me over. It was one of the 4 or 5 major reasons why I am here. Our  Reverend addressed these ideas and won me over. I do not think that this is the real reason why I worry about cell phones or other connectivity issues on assessments or in my class. Justin writes passionately about students doing what he wants (needs?) them to do while still being connected electronically through their phones or their headphones. What troubles me is a persistent belief that I have that we all benefit when everyone is engaged in class. The student who is doing solid math while wearing headphones is depriving their classmates of a strong voice and they are depriving themselves of the opportunity to explain their own thinking or to hear the thoughts of their classmates. I believe SO strongly that learning ought to be social and interactive. Maybe I am just inflating any logical concerns about relating to each other but that is where my heart and my head are right now. I don’t know how to balance what I want, what my students want, what I believe is best for the group as a whole, and the needs of the individuals. I know that there is a sweet spot there and that it almost certainly varies by class – hell, even by time of day.

I have asked my students to have their phones on their desks this year. We know that they are in the classroom and I don’t want surreptitious use in their laps. I ask them to look up stuff, I recognize that some of them use their phone as a rudimentary calculator. I don’t pretend that these don’t exist and I want to encourage honesty and openness about their presence in the classroom. Some students have complied while others have not. I speak patiently (but consistently) with those who keep them in their laps and text friends during class.

I know that I want my students to interact and I believe that they do less of it when they are plugged in to their phone or their headphones. I want students to research and solve challenging problems and I know that they do less of that when they are not connected to the internet through their phones or tablets or laptops. I chaired a committee at our school that helped develop a 1 – 1 program in our middle school. That program should soon bubble up to our high school. I believe in technology. I do, I think it improves learning and depend understanding. I am jealous of my students when I get to display complex ideas with Desmos or GeoGebra because I am old and did not even have rudimentary graphing technology available when I was trying to learn trig and calculus. I cannot tell if my visceral reactions to cell phones is at all logical and I am trying to sort that out. Justin – thanks for making me think and making me uncomfortable. Anyone else out there reading this – please poke at me through comments or through twitter (I am @mrdardy) I want to sort through these conflicts. I want to create an environment that is meaningful for my students AND for me. I sometimes feel like the grumpy old man yelling at kids on the lawn (even though I don’t have my own yard!) even though I don’t want to believe that is me.

sigh… This stuff is hard.

Great Follow Up Day

On Friday I wrote about a pretty terrific conversation that came up at the end of our BC class. We had tackled a particularly gruesome integral – (tan x)^5 and I had done so by repeated patience substitution and I chose to let u = sec x and look for combinations of sec x tan x as the du piece. One of my students stayed after and showed me his work where he shoe u = tan x and du = (sec x)^2 He was frustrated and told me that he spent about a half an hour trying to figure out why his answer was ‘wrong’. So, I typed up my solution and had it on one side of a page. (This document and the graphs I created are all linked on my last post from Friday.) I typed up the solution my student arrived at and placed it on the back of the page. I had my students working in teams so they each had my solution and their classmates’ solution in front of them simultaneously. I asked them to examine each of them and explain why they did not agree. I heard some pretty good conversations, most of them simply concentrating on making sure that they even followed each of the solutions. We had talked about it on Friday so it was good to hear them reflecting clearly on that experience. After a couple of minutes, one of my students announced that he proved that both solutions worked. I played dumb and asked what he was talking about. He explained very calmly that since one answer was based on even powers of tangent and one was based on even powers of secant, we could show that they were nearly equal. They seemed to differ only by a constant. I then showed them the Desmos graph I created and the GeoGebra graph I created. Both programs were happy with my solution and with my student’s solution. Neither program was happy with the difference between them. But I showed them that every x input we could guess at in the difference function yielded either an undefined answer or an answer of -0.75

I used this conversation with a number of goals in mind. I want them to get in the habit of talking to each other. I want them to see that there is not just ONE way to do math problems – especially ones as sophisticated as the ones we talk about in BC Calculus. I want them to think about graphs. I want them to utilize resources such as Wolfram Alpha, GeoGebra, and Desmos. I want them to notice and wonder about relationships. They are not yet where I want them to be in these terms, but the more often I remind them and the more often I model this behavior, then the more likely they are to adopt these behaviors.

If I did not believe this, I might not have the energy to keep on keeping on in this job. But I do believe it and I do keep on keeping on.

Thank you world of math resources for my students! Thank you world of recourses for me!!

We Broke Graphing Technology Again – A Success Story

In AP Calculus BC we are doing some pretty unexciting stuff right now – techniques of integration. The problems are (sort of) fun little algebraic puzzles but I find little room for conceptual conversations. Maybe I am just missing something obvious. But today was a bit of a revelation and I wish I knew better how to try and insert equations to tell the story. I’ll just have to use some tortured syntax to get my point across. I put up three pairs of integrals and told them that one in each pair was something they knew how to do before they met me (our school does BC as a second-year calculus course) while the second was one they needed my help with. I had an integration by parts example side by side with a boring old u substitution (the integrands were x cos(x^2)  versus x cos x) and they knew which one they COULD do and we talked through integration by parts. I had a partial fraction problem side by side with a  natural log problem (the integrands were (x – 2)/(x^2 – 4x + 3) versus (x + 1)/(x^2 – 4x + 3)) and again they knew the difference and we talked about partial fractions. I had a trig substitution problem against a boring old square root (this time it was sqrt (9 – x) versus sqrt (9 – x^2)) Then someone asked me a HW problem. They were asked to integrate the fifth power of tangent x. I took off writing and trying to get buy in at each of the many steps. I told them at the end that they knew each of the steps they just did not know which direction to move. I assured them that this was a process they would master with a bit of practice. As I was working, I made the decision to substitute for sec x and set up the answer in terms of that function. A student asked me why he could not use tangent to substitute. I did not have a bunch of time left so I asked him to hold his thought and talk to me at the end. He did. As a result, I made a document we’ll examine as a class on Monday comparing his solution and mine. You can grab that here I went through with math type to show his solution and mine. I’ll leave it to the students to determine why they look different and I hope they come to the conclusion that they are NOT different. To help push the conversation I created a Desmos graph and a GeoGebra graph to show my function (called d(x) in each case) and my students function (called j(x)) in each case, I will erase the f(x) that you can see by following these links because I don’t want to give the game away immediately. What troubled me was that each program dealt with my function and my student’s function just fine. When I combined them the graphing technology broke. I tweeted out to @desmos and received – as usual – a quick and helpful reply. In this case, the reply was simply ‘Thanks for sharing. This will help us make better graphs for the future.’ This is the second time this year that we have found a little glitch and I could not be more pleased with the response I have gotten each time. It is such a great way to emphasize to my students what a connected world we’re living in and how they can reach out and find help. My student said he spent a half an hour trying to figure out why his answer was ‘wrong’ since it disagreed with his text’s answer. I hope after Monday that he will begin to internalize the idea that he can check his answers in pretty powerful ways. Ways that I did not dream of when I was learning this stuff in 1982. What a fun fun experience seeing his work and getting the reply I did from Desmos. Add in the fact that I get a date with my wife at a local farm to table restaurant and the day could not get much better.

Changes for the New Year

So, I had recently blogged about some ideas to change the pace of my Calc BC class and I want to report on how it is going so far. We are one (partial) week into the new year. We lost Tuesday to extreme cold and I am losing the second of my two BC classes today because I’ll be visiting another classroom. As department chair, it is one of my obligations (and one of my real pleasures) to visit my colleagues to watch them at work.

I have two very different sections of BC this year. My morning class has seven students and they are somewhat reluctant to work together. They get along fine, they are just much more independent workers by nature. My afternoon class has seventeen students and they are much more social and collaborative.


I want to summarize the past two days by section, rather than by day.

Yesterday we were in our computer lab for both sections working on the Desmos activity I slightly modified from Sam Shah’s Virtual Filing Cabinet. By the way, if you haven’t seen this resource, click on the link. You’ll be glad you did. My 1st period class was typically quiet and worked individually with only a little bit of collaboration. I started class with a quick exploration of the polar functions of the form r = 1/(1 – kcos(theta)) and r = 1/(1-ksin(theta)). After five minutes, I left them alone for the next half an hour. I wrapped up class with a verification that, when k = -2, the graph is a hyperbola. A Desmos graph shows this quickly and some recall from precalc days allowed us to convert this to a rectangular equation. It was not a pretty one and the process required recalling the standard form of a hyperbola as well as remembering how to complete the square. I was pretty much the lone voice (unfortunately) but it sure seemed like they were all fine. Today, they worked on the problem set that I also linked to in my last post. I sat and worked myself and had all 7 of them sit at one of my two big tables together. Normally they split themselves with five at one table and two at the other. I thought that this would encourage more collaboration. Instead, I sat working quietly for 30 minutes while they all worked quietly as well. No talking, no looking over each other’s shoulders, no recognition of each other at all that I could see. I must admit that I was getting kind of frustrated. At one point, I catch the eye of one of them and his attention seems to be wandering. I ask him why he’s not talking to anyone and he says he answered them all except for the first question. This is very surprising to me on a number of levels. I think that the first question is the most straightforward (and most related to Calculus) and I thought that this was the one that would seem the least intimidating. The next fifteen minutes were spent sharing solution ideas to that problem as well as the other problems (we only made it through the first five together) and I have to admit I was knocked out by their creativity. Especially on the question involving counting digits. Three of my students actively shared their solution ideas and they just knocked it out of the park. Frustration turned to a combination of delight and confusion. I’ll ask some of my questions later.


Yesterday, my afternoon class also met in the computer lab to work with Desmos. Again, I spent about three to five minutes looking at an animated drawing of the polar curves I mentioned above. For the next thirty minutes the class had a consistent hum of chatter, people arguing with each other about conclusions, kids looking at each other’s work. When I reconvened the class to focus on the same k = -2 case, they were engaged. telling me what the hyperbola equation was, catching a mistake I made in factoring, just a lively discussion. When class ended, I checked in with two students who were just packing up. One of them said something to the effect that my class made his head hurt a bit. He said it cheerfully and his neighbor said that my class was ‘interesting’ which is the word I use to describe difficult or challenging questions. He, too, said this rather cheerfully. I won’t be around to see them work on the problem sheet but I have asked the colleague who is subbing for me to collect their work so I can see what they can accomplish and how they approached these problems.

Now, I am left with these questions as I move forward.

  1. How do I create a situation so that my first period class actually talks to each other?
  2. Is it important enough to make that happen, given that they are productive workers? I have a pretty strong belief that talking about ideas is important, but I don’t know how to win this class over to that point of view. Is my personal bias important enough to try to change the nature of my learners in my 1st period class?
  3. Can I build momentum for these problem solving days if they only happen once per week?

I’ll keep reporting on progress and I’ll keep an eye on any wisdom that you can share int he comments section.


Brrr…

So, today we saw school cancelled due to the cold weather here. Woke up to an air temp below zero and wind chill about 20 below. Took the morning to finish the first of my weekly problem day assignments. I’m sticking to my guns and using this Thursday as our first class work day despite losing today to the weather. I sent out a parametric/polar practice sheet to my kids and asked them to spend some time with Desmos. Tomorrow we’ll be in the computer lab working with Desmos (gotta get started on that doc next) and then we’ll have our problem day. I’ll report back on how it goes. The doc I created that is linked above is a collection of stuff I’ve scoured from the web.

Parametrics / Conics

As I have written before, we teach AP Calculus BC here as a second year Calculus course in our school. This gives me loads of time to play and explore with these students. On Monday we start up again – weather permitting – and we start with our study of parametric and polar equations. Our precalculus class does not cover either topic in great depth (a situation I hope that I can remedy starting next year) and a number of our BC kids are ones who start off in AB Calculus when they come to our school. With so many of our students coming from different parts of the world at different times in their career, we have a wide variety of experiences in the BC group. I guess this is a long-winded way of saying that I have to treat this material as if they have not encountered these ideas at all, really. I intend to spend two days in our computer lab working with building up some fluency with Desmos. I have my room set up in a sort of Harkness-style where the kids are facing each other. Being in the computer lab gives me the flexibility of having the students work with Desmos in a hands-on fashion rather than just watching me. That’s the plus. The downside is that they are working in isolation in this room. I’ll have to deal with that downside for a few days. So, I was digging through my memory bank and I remembered that the great Sam Shah had written a lovely post about introducing conics through Desmos. I downloaded his Scribd file and modified it a bit (you can see my version here) but I still need to go back and play with it a bit more. The way the file looks to me now is way too close to plagiarism – though I do give his website a nod of thanks there. I want the language and the feel to reflect my language and the way my students react.

I am making a real commitment to myself to get out of the way more in 2014. There was a lovely piece that was tweeted out by an old colleague named Gayle Allen. It was called ‘Becoming Invisible in My Classroom‘ and it has given me a renewed sense of mission here. I am also thinking of my visit to SLA last year for EduCon. I walked into a physics class and could not figure out who/where the teacher was for a few minutes. I was amazed and humbled. Need to hold on to that feeling…

So, I’ll start on Monday with a bit of leading/lecturing to set the stage. I’ll give them an assignment to play a bit with Desmos Monday night, then we hit the lab. I’ll be giving an update on how it goes. Wish me luck!

PS – I have a fun Desmos file to look at for them as well. You can see it here. It’s fun to animate the slide and see what happens.

MTBos Mission #3 – Daily Desmos

So, the challenge this week was to pick a collaborative site and … collaborate! So, I chose DailyDesmos for a number of reasons. Years ago, when I was a student again for a glorious time, I fell in love with GeoGebra. For the past few years I have been preaching to my students and colleagues about the wonders of GeoGebra. I reached out to a colleague from Lawrenceville and had him come out and do a workshop for my school teammates. Fun has been had with GeoGebra. Recently, I was introduced through the wonderful blogger world to Desmos and I am in the process of falling in love with it as well. Recently, with my precalc honors class we had a triumph using Desmos. I blogged about it on Sept 10 and included this link ( https://www.desmos.com/calculator/nvinc8pwdh ) when my kiddos wrestled with creating a trig function to match the daily average temps of my old, beloved hometown of Gainesville, FL. This morning I dove in and took on challenge 201a ( http://dailydesmos.com/2013/09/23/daily-desmos-201a-advanced/ ) which was presented by the awesome Michael Fenton. Here is my crack at a solution to that one ( https://www.desmos.com/calculator/zmuvzpmvti ) and it is probably not as dynamic as it could be. I still need to learn about leaving traces behind rather than simply having the slider generated graph be new at each stage. I am imagining a sort of spirograph and I am certain that Desmos can handle that. I still love my GeoGebra – especially for individually rescaling axes as I go – but I am finding room in my heart for Desmos as well. As my school inches toward greater tech integration, I am seeing a day where my students would be spending time in class (on their own or in their pods) where they are tackling these daily challenges now and again. I am also dreaming of a time when I feel that I have time and energy on a regular basis to tackle these challenges.

I have thoughts about these graphs that I need to organize and make coherent. Another post for another day.