Trying to Understand a Curious Misunderstanding

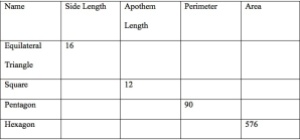
Last week it felt as if my Geometry class as making great progress in examining radians, looking at areas of regular polygons, dealing with a new vocabulary word (apothem), and generally doing a nice job of making connections – especially with the right triangle trig that we are now leaning heavily on. Well, Friday morning we had a conversation that I am still unpacking. On their HW from Wednesday night one of their tasks was to complete the table below:Polygon Table
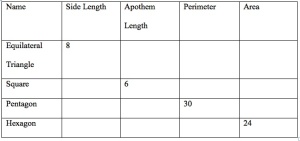
When my students asked me to review this problem I started by drawing an equilateral triangle and its apothem. I know that it is more efficient to use our knowledge of the triangle area formula, but I wanted to reinforce our new formula that the area of any regular polygon is half of the product of the apothem and the perimeter. Unfortunately, when I drew the picture they asked me why I drew what I drew. They wanted instead to draw an equilateral triangle and its altitude. I followed this suggestion by drawing the following figure:                                       Incorrect Apothem
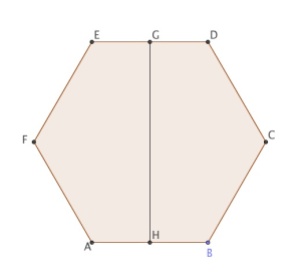
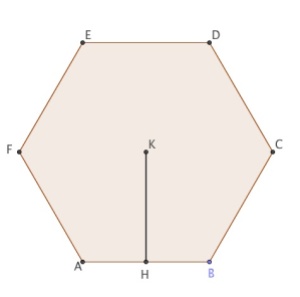
They were quick to identify that this is not, in fact, an example of an apothem. Pretty much everyone agreed to this quickly. Instead they instructed me to draw the following figure:

Correct Apothem

I have been trying to figure out why so many made the same mistake and, after talking to one of my Geometry teaching colleagues, I have a theory. I keep drawing pictures like this one: Polygon with Inscribed Triangle
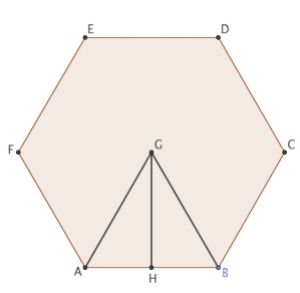
I fear that seeing this drawing repeatedly has somehow convinced some of my students that the altitude of a triangle is simply the apothem. I know that I pointed out the similarities between the terms when I was trying to help them remember this new word. I talked about how altitudes and apothems were each perpendicular to a side (and that they both begin with the letter a). However, I do not know why some students would simply draw an altitude and figure that, for some reason, we are now calling it an apothem. So this was a disappointing way to start the day. I think I feel a little better now that I have a feeling where the triangle mistake came from. Have any of you experienced something similar?

The other disappointment came when they asked me to address the next HW question. They were again asked to fill out a table, Here is the second HW problem:

Second Polygon Table

I suspect that most of you see some similarities between the first two HW questions. My students did not. I understand that when you are learning something new it is hard to step back and see big picture things going on. However, I also know that this type of HW problem is tedious and I hope that my students are thinking of ways to streamline the process. Instead of recognizing that the triangles in the two problems are in a 1 to 2 ratio and using our knowledge of similarity and scale factors, many students simply reset and did the problem from scratch. I try really hard to build in these sort of  connections in my assignments and my tests. I do not expect students to recognize that in October, but I would hope that they do by May. I’d love some advice about how I can better help my students look for these types of connections. How can I help them step back a bit and see these connections?

Back at it 8 AM tomorrow. I’m optimistic we’ll have a good week. Test on Wednesday – I want them to really kill it on this one.
Catching Up with the Past Week

So there are a couple of activities this past week that I want to write about. However, I have been swamped with meetings so I have fallen a bit behind.

In AP Stats we have finished our required curriculum as of 8 days ago. I am a big baseball fan and my favorite team is the New York Mets. They are having a pretty wonderful start to their year (or at least were until the last few days) so last Friday I posed the following question to my kiddos: Given that the most optimistic projection I saw for the Mets’ season had them pegged as an 87 win team, what is the likelihood of their current record (which, if I remember correctly) is 10 – 5? I liked this for a few reasons. First, it concerns baseball and likely would have a positive outlook for my Metropolitans. Second, it was not so focused on the most recent material at hand. My Stats students tend to know recent material well but struggle remembering other procedures that have not been practiced as recently. Third, it generated some nice thinking out loud about what approach to take. Being more of an algebra stream guy myself I immediately placed this in the context of a probability problem and was prepared to go down a Pascal’s triangle/binomial theorem path. Most of my Stats students don’t tend in this direction so their conversation focused instead on comparing proportions – the 87 – 75 projection with the 10 – 5 proportion. They suggested running a two proportion z test and looking at the corresponding p-value. This opened up the avenue for me to sneak in my approach and make a connection pretty visible to them. Turns out that we felt that we had enough evidence to reject the null hypothesis of the Mets being an 87 win team in favor of believing that they will exceed that win total. Their recent 5 – 5 run of games might adjust that but I do not want to know this – so I will not re-run the test right now! After we checked our trusty TI to find the p-value of this test I reminded them of the probability approach and we set up the appropriate term of the binomial expansion. Guess what happened? This calculation matched the p-value of the two proportion z test!!! This is one of those ideas that we discussed but somehow seeing these results side-by-side seemed eye opening to my kiddos. A triumph on a number of levels!

In my morning Geometry class we dipped our toes into an exploration of radians yesterday using the ProRadian Protractor designed by the fantastic Jennifer Silverman (@jensilvermath) and using an activity that she designed. I wrote a follow up HW assignment that my kiddos worked on last night. I also linked to a fabulous web site that allowed my students to explore radian measure and I shared these notes with my colleagues. There is also a lovely GeoGebra applet (also designed by jennifer Silverman) that is linked from the worksheet. I was totally excited to explore this activity with my students and I had a really nice chat with one of my teammates.

I handed out the radian protractors as well as our regular old angle protractors and we had a nice conversation about similarities between the two protractors. We had a lovely discussion about this but, looking back on yesterday , I think I allowed too many clues to seep into the conversation too quickly. Jennifer’s activity is a terrific one and I got in the way by loading too many conversations in at the beginning of the class. By having students come to my screen and try to identify where one radian measure would lie on the circle AND by having the protractors side-by-side I reduced the mystery element that I think should have been part of the classroom activity. I think I took away the opportunity to discover what was happening here. I did have one student give a GREAT explanation of why the quadrilateral radian measure was twice the triangles radian measure. She invoked a proportional idea and referenced our (n – 2)*180 formula. I had a number of students quickly see that the ratios we had been working with before (frac{x}{360}=frac{arc}{2pi r}=frac{sector}{pi r^{2}}) could be easily extended to add one more simple fraction of frac{x}{360}=frac{theta }{2pi }. That definitely felt like a triumph. So, the lesson I learned here – and I hope I remember it for next year – is to be a little more minimalist in front loading this conversation. I think that we can touch on all of these resources and really let the discovery sink in, but I feel I nudged them a little too much this time around. So the plan for next year is to hand out the radian protractor and work through the worksheet. Then hand out the angle protractor and talk about comparing them. Then, the next day after some time to think, show the web app and have them identify where one radian is. Let this unfold a little more slowly.

A Quick Geometry Snippet

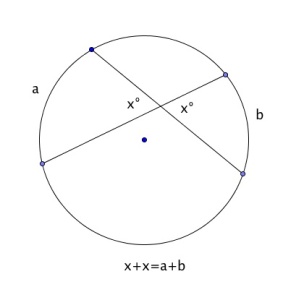
So, we were reviewing this morning in Geometry getting ready to finish up our circle unit. I was reminding the kiddos of the angle and arc relationships we have been discussing. I had been writing things like x=frac{1}{2}left ( a+b right ) where x is an angle formed by the intersection of two chords and a and b are the measures of the intercepted arcs. However, today as I drew my diagram for it one of my students suggested I mark is as seen below. Interior Angles

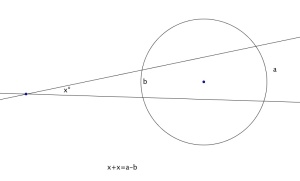
I think I am delighted by this and will write it this way from now on. It feels to me that it is a more natural way to think about this relationship instead of having a coefficient of 2 or a coefficient of 1/2 that might not seem at all intuitive. I then drew the following Exterior Angles

I’d love to hear from some other teachers about whether this seems at all like an improvement over the more standard way of writing these equations.

That’s all for now, just needed to get that off of my chest!

Highlights of a Stressful Week

So, there have been many scattered thoughts on my mind in the past week but there are also three things that happened that are just completely awesome.

  1. My pal John Golden (@mathhombre on twitter) steered a number of his teacher training students over to a post on my blog and twelve of them chimed in with comments. Totally cool! One of them decided to follow my blog and I took the time to respond to each of them. LOVE the idea of new teachers in training dipping their toes into this rich world of teachers blogging and sharing. I am also flattered that John thought my virtual home here was worth a visit.
  2. I woke up Wednesday morning with a message on twitter from a teacher in Louisiana who asked if he could use my Geometry book at his school next year. I am so excited by the idea that this work might be used at another school.
  3. In my Geometry class this week we are talking about angle and arc relationships. One of my students stayed after class one day this week and she had this to say. “You know, I was thinking, when will this be important? I mean, when will I need to find an arc length like that? Then I realized that the work we are doing to find that length is what is important. Pretty cool.” Wow.

Some Fun Geometry Action

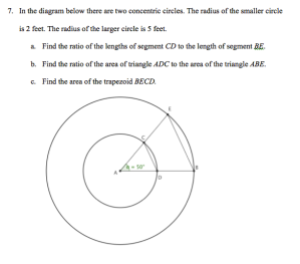
On the heels of learning some right triangle trig I am really trying to develop more proportional logic with my students. Just this week we had a really productive conversation about the following problem.

Screen Shot 2015-04-09 at 6.45.44 PM

Being a bit of a bull in a china shop sometimes, I proposed that we should find the height of each triangle, find each chord length and find the height of the trapezoid by finding the difference of the heights. Not elegant, I know. I was trying to make sure that we remembered some right triangle trig. that we remembered our area formula for a trapezoids, and that we try to develop some patience in solving multi-step problems. That was my plan, but as with many school plans, it did not quite unfold that way. One of my students who is a bright and quick problem-solver pointed out that simply finding each triangle area would be enough. I understand that his solution is pretty much the same as mine, but it certainly sounds more efficient. But as soon as I acknowledged that his idea was more efficient than mine another student trumped each of us. She pointed out that I had already asked them to consider the ratio of areas between the two triangles. So, if we know one area, we can automatically know the other area. If we know both areas, we find their difference as suggested by the first student who chimed in. I was so happy that she took my clue from within the problem and that she was clever enough to really save time and energy this way. I made sure to compliment her in class and I bragged about her work to two of my colleagues yesterday. Oddly, this morning when we were reviewing before today’s quiz I reminded her – and the rest of the class – of her clever idea. She had no memory of this conversation. Sigh…

I’m trying to process this and figure out what it might mean for my classroom practice. I understand that I should be more excited by my students’ ideas than they often are. I understand that I will remember context of conversations more easily than they will because I am not dealing with the cognitive load of trying to learn/understand the conversation. I am simply coming at it from such a different place. What I don’t understand is how a student can be so in command of an idea but then not remember the creative process that made her arrive at this clever conclusion. I discussed this in the faculty lounge right after Geometry today and one of her other teachers intimated that this might simply be modesty on her part. I am not sure how much faith I put in that reading.

So, while I am a bit frustrated and confused, I am choosing to focus instead on the positive energy of yesterday’s conversation, on the clever ideas that my students brought to the table, and on the fact that my students did a really nice job on their quiz today.

Rock, Paper, … Chi-Square!

In my last post I talked about how my students are benefiting from my pals in the MTBoS. Well, here I am to testify again. We are just about to wrap up our study of the Chi-Square distribution in our AP Statistics class. I used to start this unit with a little document I created based on an article in Malcolm Gladwell’s Outliers. In his book he posits the idea that there is a disparity in birth date distribution for players on a junior national hockey team. In the document I linked to I put the roster information into an EXCEL spreadsheet and I just displayed the data and asked my students to notice things. I felt like I needed to stop using this because in each of the past two years I had a number of students who read the book in an English elective and they gave away the surprise before enough conversation happened. So, I put out a twitter call for help and Bob Lochel (@bobloch) chimed in and directed me to a super helpful post over on his blog. I had seen the cool applet for playing Rock, Paper, Scissors over at the New York Times. So, I borrowed heavily from Bob (and made sure to credit him during our class discussions) and off we went to the computer lab. I prepared a handout to help organize my students and I set them loose. I asked (as you can see on the handout doc) my students to play 24 time in four different contexts. Play with random moves generated by a random integer generator or play with your gut instincts and try each against the two modes of the machine on the Times’ website. The NYT claims that the ‘robot’ plays either as a novice with no pre-programmed knowledge of how the game is played or as an expert with data gathered from other players. The novice learns your patterns as it plays you while the expert calls on a large data set of how people behave. 24 repetitions is probably not enough for the novice computer but I had some time constraints that I was trying to work around. After both of my classes played, I created a document with the data on all of the results. The next day I displayed the data and we had a pretty great conversation about the results. An important note – some of my AP Stats kiddos cannot count because the data did not come in in multiples of 24. Sigh

So I tried to start the conversation with  a simple question – Should you do better when you think about the game or should you do better by random number generation? This lead to a quick decision that the expected value of a random number generator would be an equal distribution of 8 wins, 8 ties, and 8 losses for each set of 24. Now the table is set for the important principles of the Chi-Square test. Let’s talk about the difference between observed results and expected results. We also had a great conversation about how it appeared that the random number generator actually outperformed many people – especially in the expert mode. We talked about the fact that the expert mode was trying to predict behavior and how the randomness involved here might actually play in our favor.

In the week plus since this experiment I have been able to refer back a number of times to this experiment and it feels like my students have a pretty good handle on their task here. We have our unit test tomorrow so I hope that my optimism will be supported by some data.

In addition to thanking Bob Lochel I also want to thank a new twitter pal, Jennifer Micahelis (@MichaelisMath) who engaged me in a conversation about this experience and prompted me to gather my thoughts and write about it. I definitely will revisit this experiment the next time I teach this unit.

Borrowing from the MTBoS

I’m guessing that most of you reading this are familiar with the awkward acronym for the Math Twitter Blog-oSphere – one of the joys of tapping into this community is that they are remarkably generous about sharing ideas and resources. Today in our Geometry classes (I teach only one of the five sections we have at our school) we used an activity written by Kate Nowak (@k8nowak on twitter). It is an activity based in GeoGebra and allows the student to explore the ratio between lengths of legs in a right triangle. You can find the document we used here . I modified (very slightly) the document that Kate originally posted here. Next time I use it I will tweak it a bit. I have only twelve students in my class and chose not to explicitly team them up. They talked with their neighbors as they are usually encouraged to. However, the directions either need to be tweaked so that team references are excluded or I need to clearly team them up. I am also debating question 7. A number of students did not make the explicit leap from using the ratio they found on page 1 and using it here. I don’t necessarily want to give away too much but I may add a little prompt that they should consider the work that they have already completed. We set up a google spreadsheet and in the next couple of days I will refer to this repeatedly to show that different students working on different triangles were arriving at the same ratio. We make a big explicit deal about scale factors between similar figures. I do not think we spent enough time pointing out that scale factors within figures will also match up for similar figures. I will definitely make this more of a point of emphasis next time through my text.

I cannot thank Kate enough for sharing this activity. My students worked well and I am convinced that they will have a more solid grasp of trig ratios moving forward. As I plan out the rest of the unit I am also going to be borrowing from Sam Shah’s latest post about trig. You can find that over here.

Man – the benefits my students are reaping from people that they will never meet – such as Kate Nowak, Jennifer Silverman,  John Golden, Jed Butler, Sam Shah, Pamela Wilson, Meg Craig, and so many more – is just remarkable.

Show but Don’t Tell

So in Geometry today we began to study the ‘special’ right triangles and I had an idea last night that I wanted to try. I handed each of my students two pieces of paper, a ruler, and a protractor. On the first page I asked them to draw an isosceles right triangle on each side and asked them to have the legs of their triangles be different lengths. I polled the students and had them tell me one of their leg lengths. I then asked them to find the length of the hypotenuse and tell me what number they get when dividing the hypotenuse by the leg length. I, of course, got a variety of answers all of which hovered around 1.4. Some students used the Pythagorean theorem and gave me decimal approximations. Some used the Pythagorean theorem and gave me radical answers. Some measured the hypotenuse with their rulers. I asked them why these answers seemed so close to each other – I specifically avoided the word similar here. Luckily, one of my students told me that all the isosceles right triangles were similar to each other. I pushed back a bit and asked what that had to do with ratios within one triangle. We usually discuss similarity ratios between triangles. The explanations from the students were not as concise as I hoped but we all seemed comfortable that rations within a triangle will be the same when looking at two triangles (or in this case 12) that are similar to each other. Since a few students used radicals we had the exact ratio in front of us and a quick solution using algebra confirmed that the ratio was the square root of 2. Success!

Next up I asked them to draw two equilateral triangles and construct an altitude. Now I asked for the ratio between the altitude and a side length. These answers all hovered around 0.87. We were running out of time now so I did a little more telling than I wanted to but we saw the ratio for the three sides of this new right triangle were 1 : square root of 3 : 2

I have to say I was pleased with their persistence, with their measuring/equation solving, and with the idea that we could see these ratios without simply giving them formulas to try and remember. I may be an incurable optimist, but it feels to me that these ratios will be easier to remember at this point. Now I need to have the discipline to avoid using the words for the trig ratios for at least a few days. I am going to steal ideas from Kate Nowak (here is her trig blog post) and Jennifer Wilson (you can find her trig wisdom here) as I attempt to shepherd my Geometry students through the tangle of right triangle trig. I feel that we had a good start today!

Back in the Groove

Our school has a two-week spring break at a silly, early time in the year. We have been back for a week now and I feel like my students and I are all getting back in the groove again. I know that the dreaded senior slump will continue to pick up momentum but at least I am still seeing some energy and engagement from most of my seniors.

I have a few posts bubbling in my brain and I suspect it’ll be a busy blogging week. Tonight I want to briefly touch on my AP Calculus BC class. We are just settling in to our last major required topic of the year, the Taylor / Maclaurin polynomials. I wrote a little GeoGebra demo (you can find it here) and I started off by showing them (without revealing the mechanics behind the scenes) a polynomial approximation of increasing degree for the trig function y = cos x. We played a little noticing and wondering and saw that at certain stages the polynomial did not change. It did not take long to deduce that this happened at the odd powers of the Taylor polynomial. This led to one student remembering something about the symmetry of cosine, another student mentioning that this was a y-axis symmetry and, finally, a third student mentioning that this is even symmetry. So the lack of development due to the odd powers of the Taylor made a little sense. We then switched to y = sin x (as in the link above) and, unsurprisingly, saw that the even powers seemed to do little or nothing here. We did a little more noticing and wondering watching the Taylor expand on GeoGebra. I should note that all of this was centered at x = 0 (or, in the Taylor notation, we had a = 0) GeoGebra’s sliders allowed us to begin shifting that value and some interesting (and ugly/scary) things started happening to the Taylor equation. My kiddos quickly saw that the equation seemed to be undergoing a simple horizontal transformation – at least in the x terms. The coefficients were changing in some mysterious ways. Finally, we looked at the Taylor series for y = e^x. One of my students asked a great question at this point. He asked – Why are there all those factorials in the bottoms? I skipped this question around the room a bit to see if anyone wanted to make a guess. They quickly observed that exponents in the numerator were clearly attached to the factorials int he denominator but – understandably – they had no solid guesses. Without giving away all the mechanics (we have plenty of time for that) I asked what the derivative of x^7/7! is. I was told it would be 7x^6/7!   Correct for sure, but unsatisfying. I must have made my unsatisfied face because one of my students offered a much cleaner version of that answer as x^6/6!  Again, I did not go into the mechanics at this point, but there did seem to be some sense that this was an interesting thing to note. I was pleased by the power of the graphics of the GeoGebra applet. I know that I could do something similar in Desmos but I don’t know the commands there as well as I do in GeoGebra. I will start class off tomorrow with the power series we derived for e ^ x and I’ll ask for derivatives and integrals of that. Should be fun to see them realize in this format why the derivative of e^x is itself.

Fun to be back and excited to unfold Taylor’s series’ with my students. This was one of the genuinely awe inspiring topics when I studied Calculus. I remember being amazed by this idea and it’s mechanics. I hope I can share that wonder.

Delighted

A quick post here – I want to share something delightful that a few Geometry students did this morning. We had our last test of the winter term today and here is one of the last questions:

Prove that the points A (x, y), B ( x + 1, y + 3), C (x + 4, y + 5), and  D (x + 3, y + 2) are the vertices of the parallelogram ABCD. Prove this is true by one of the following two methods:

  • By showing that one pair of opposite sides are congruent and parallel.
  • By showing that both pairs of opposite sides are parallel to each other.

So, I was hoping that the majority of my students would take the quick and easy option of calculating slopes rather than messing with distances. I also hoped that the coordinates having variables in them would make them slow down, be careful, and remember a touch of algebra. I grade page by page and I have graded three of the papers with this problem on it. One student said ‘We can let x and y be 0 so the coordinates are (0,0), (1,3), (4,5), and (3,2)’ I love this thinking. She avoided the worry of dealing with the variables here. It’s a little slippery to determine just how clearly she was thinking here. She might have just been dodging a bullet. One student said ‘I will first transform this parallelogram by the vector <-x, -y> and then we will have the coordinates A’ (0,0), B’ (1,3), C’ (4,5), and D’ (3,2)’ Now, it is ABUNDANTLY clear that he knew exactly what he was doing. I’m so delighted by this that I felt I should share.

This and my great AP Stats classes today made for a pretty terrific day!